Latest Features
Heart Rate Variability: What it is and Why it Matters
Brazilian scientist, hedge fund manager and diving instructor Sergio Schirato geeks out on some of his team’s latest research on heart rate variability as a potential indicator of decompression stress. If that doesn’t boost your HRV, what will?

by Sergio Rhein Schirato, PhD
Header photo by Lorenzo from Pexels
Heart Rate Variability, or simply HRV, is becoming more and more used in different fields, from an instrument able to diagnose cardiovascular anomalies, to a tool instrumental in improving high performance sports training. Many of us who are seriously into physical activities and sports practicing are familiar with or even have used one of the many apps available for watches or smart phones. But do we really know what they are?
Well, HRV is simply the variance in the interval between two heat beats. Or to be more precise, the changes in the interval between successive normal heartbeats. Usually, this is assessed through the timing between QRS complexes, which are main spikes as seen in a continuous electrocardiographic recording (ECG). HRV is the result of the balance between the sympathetic and the parasympathetic branches of the autonomic nervous system (ANS), as well as of other non-neural sources of variation. From a practical standpoint, it is as simple as a collection of time intervals, or for those more familiar with mathematical terms, it is a time series (a series of data points indexed by time).
Typically, these time intervals are not fixed or static but can vary widely moment to moment in response to input from the sympathetic and the parasympathetic branches of the autonomic nervous system, which control the contraction and relaxation of the cardiac muscle. Each system is activated by multiple receptors, responding to arterial pressure (baroreceptors), oxygen, and CO2 levels, as well as endogenous substances, emotions, immunological alterations, among other stimuli.


The parasympathetic branch, which regulates your energy and helps your body recover during rest periods, is mediated mainly by acetylcholine and is responsible for maintaining homeostatic heart frequencies and contractility without exhausting. It is responsible for short-term fluctuations of the heart frequency, and it operates in a frequency between 9 to 25 cycles per minute or 0.15Hz to 0.4Hz. Note that Hertz (Hz) is an international metric of frequency and is defined as one cycle per second (cpm).
Conversely, the sympathetic branch, which regulates your “fight or flight” stress impulses, is mediated mainly by norepinephrine, and its activity is triggered by stress, increasing cardiac energy demand by increasing heart rate [1]. This branch is responsible for longer-term fluctuations of the heart frequency, operating in a lower bandwidth of 0.04Hz to 0.15Hz (or 2 to 9 cycles per minute).

HRV is commonly studied in the time and frequency domains, that is as a function of time and frequency. Different HRV indicators have been associated with sympathetic or parasympathetic activity. Additionally, there is an important association between specific frequencies and the baroreflex function, which provides a rapid negative feedback loop to adjust our heart frequency in order to maintain blood pressure at nearly constant levels.
But wait, what do time and frequency domains mean?
Let us start with the simpler one, time domain. In mathematics, the domain of a function is the set into which all of the input of the function is constrained to fall; therefore, when the term time domain is used, it simply means that we are doing our analysis based on time intervals extracted from the ECG recording. There are many indicators that have been created to study the variance in the intervals but here we will discuss only two of them, SDNN and RMSSD.
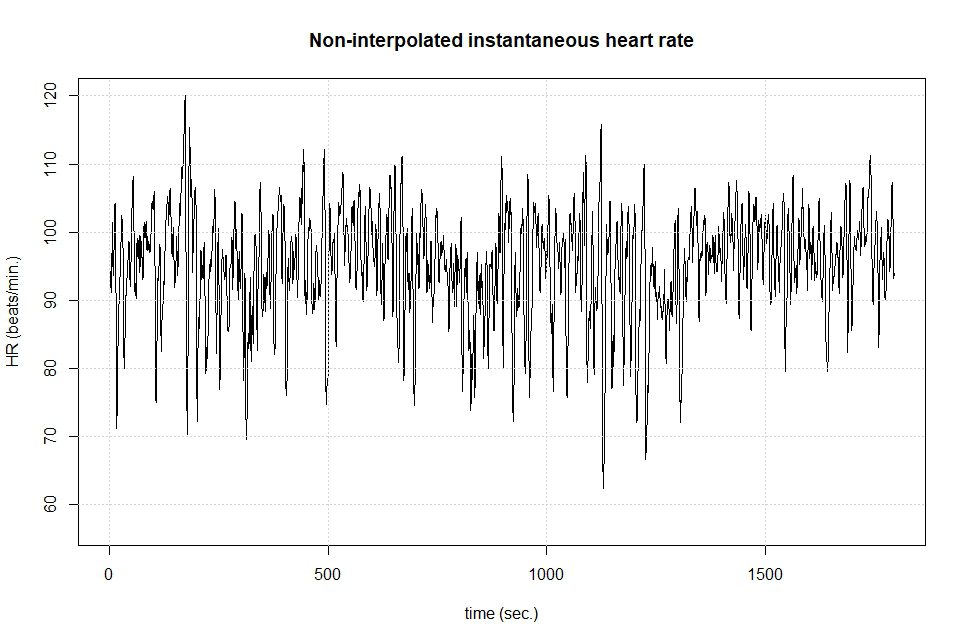
SDNN is the standard deviation, a measure of variation, of the time interval between heart beats (the R-R interval), and reflects all the cyclic components responsible for variability. The greater the SDNN, that is the variation between beats, the better. RMSSD is the square root of the mean squared differences of successive R-R intervals, or the variance of the variance of our time series, and is considered to be related to the parasympathetic activity. Both, SDNN and RMSSD are powerful indicators of our cardiovascular health, since the loss of variance between intervals is associated with many cardiovascular and/or inflammatory diseases. As shown below in Figure 3, we want our heart rate frequency to fluctuate a lot over time.
Now that the main time domain indicators have been defined, let us move to the frequency domain. But first, we need to understand one important math concept: any function or time series—think of the graph of a curve—can be re-written as a summation of sine and cosine functions, which are used to model phenomena such as sound and light waves. This idea was first introduced by Jean Baptiste Fourier in 1882 in his work Théorie analytique de la chaleur and later became known as Fourier series.
Figure 1 shows an example, using an arbitrarily chosen function:fx=x3+ x2+3x+5, plotted in the interval ]-π to π [. The resulting data shown as a curve can be reconstructed using a summation of sines and cosine functions through a Fourier series. In this case, twenty sine/cosine functions were used to approximate the curve, while in Figure 2, fifty functions were used.
It is easy to see from the diagrams that, the more functions we use, the greater the precision in the reconstruction of the original data. In both cases, we are using the sum of sine and cosine or “wave” functions to approximate the curve fx=x3+ x2+3x+5 in an ordered way. Each of the component sine and cosine functions correspond to a specific frequency. In this way, a curve can be broken down into its constituent frequencies.
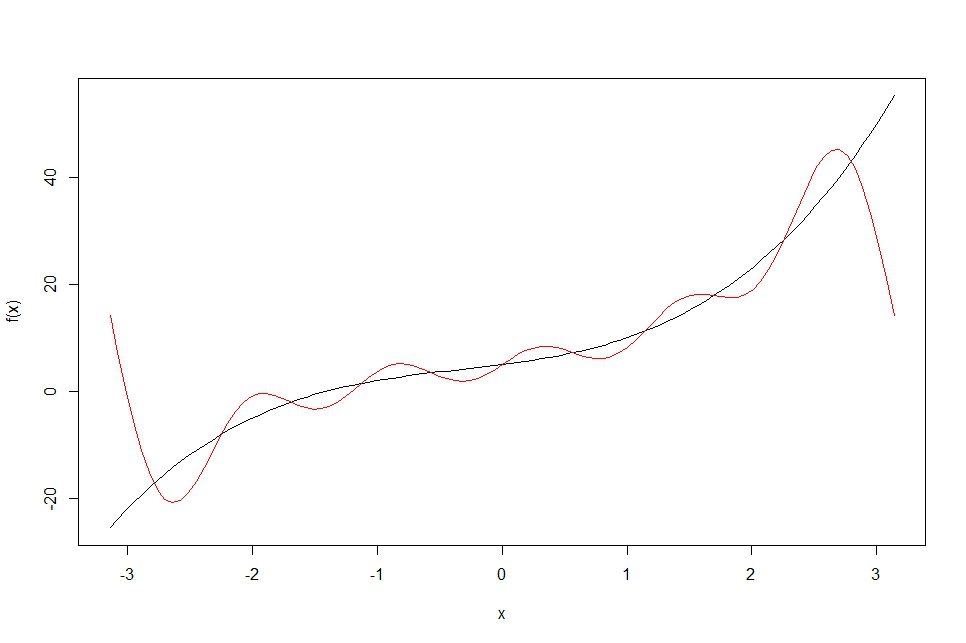
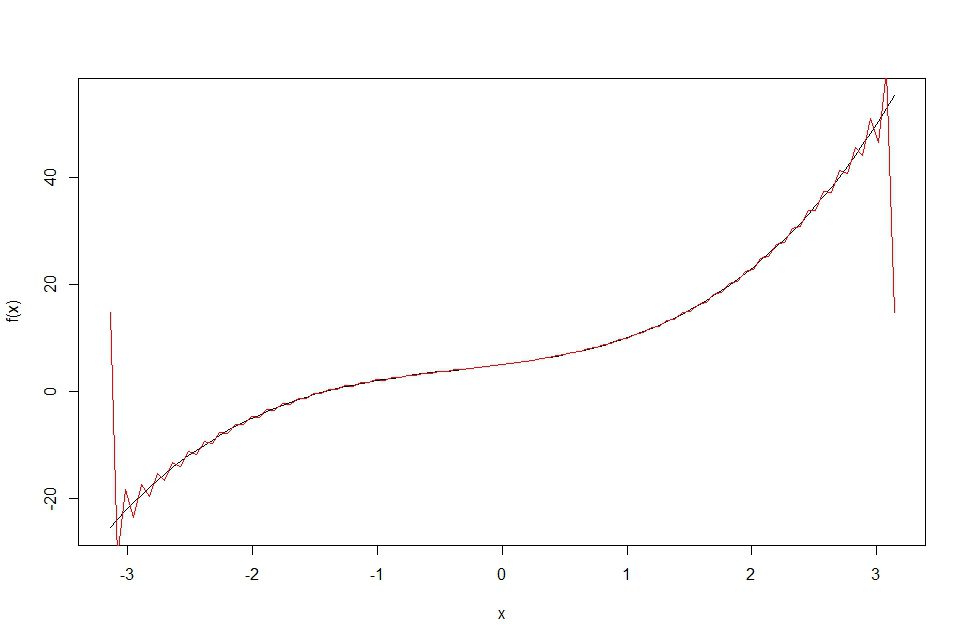
Figure 3 shows the intervals between heart beats i.e., the R-R intervals extracted from a ECG recording and plotted against the time domain, which shows the variation of the heart rate frequency over time.
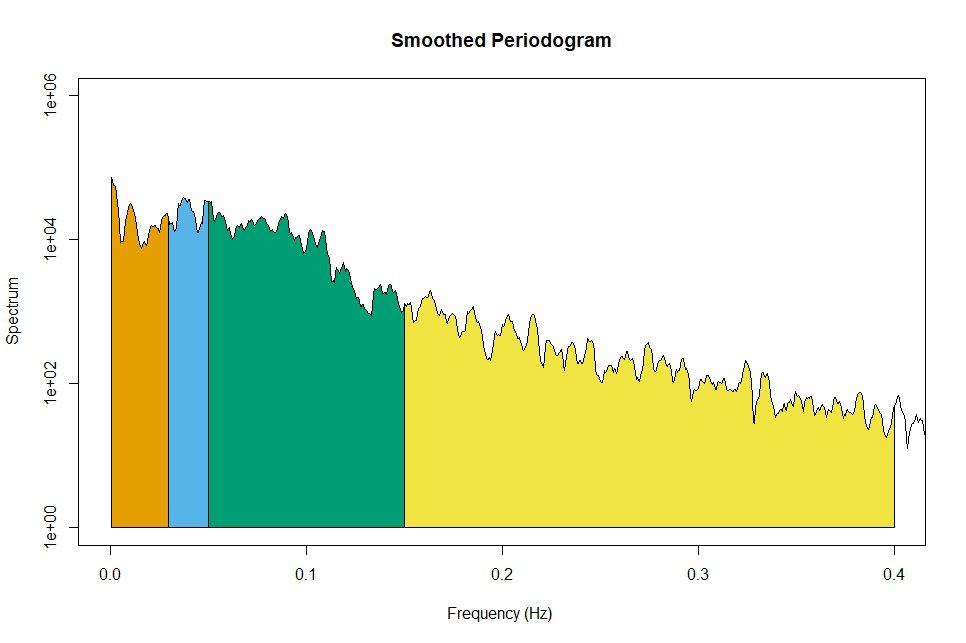
The next step is to approximate the waveform or curve formed by the heart beat data displayed in Figure 3 as a summation of functions through the Fourier series. This enables us to determine all the frequencies that are acting in our system. The frequency domain indicators are thought of as the “power” associated with each frequency—think of it as the relative contribution of that frequency in the re-construction of the curve formed by the data and calculated through a Fourier transform. These are usually plotted in a spectrogram, a graph where the x axis corresponds to the frequencies and the y axis to each frequency’s power or contribution, like the one displayed in Figure 4.
Now we are ready to define each one of the frequency domain indicators, categorized according to its associated frequency. They are:
- Ultra-low and Very-low Frequencies: 0.01 to 0.04 Hz, not relevant in most cases, due to the relatively short ECG recording usually used.
- Low Frequencies (LF): 0.04 to 0.15 Hz
- High Frequencies (HF): 0.15 to 0.4 Hz
In the beginning of this article, we noted that the branches of the autonomic nervous system (ANS), that is the sympathetic and the parasympathetic branches operate in different frequencies. Based on that, we can see that different HRV indicators in the frequency domain might be associated with sympathetic or parasympathetic activity.
High frequencies are highly impacted by the respiratory pattern, while low frequencies are affected by both the sympathetic and the parasympathetic branches of the ANS. Therefore, by analyzing the power or contribution associated with different frequencies, we can make inferences about the activity of each of the branches of the ANS and their interaction with other systems.
So, why does that matter?
Going back to the beginning of this article, most of the applications, i.e., “apps” used by smart phones and watches to track HRV perform their analysis are based on SDNN, which is a simple-to-calculate and powerful HRV indicator. It’s use is based on the idea that after a workout, the activity of the sympathetic branch temporarily prevails, reducing the overall variability and hence the SDNN.
In this sense, the tool can be used to avoid overtraining, adjusting the intensity of the training session according to the monitored HRV, until the measured SDNN returns to its pre-training values. The same concept can be used to measure stress levels. In theory, all other factors being the same, the more stressed we are, the less variability, and therefore a lower SDNN can be expected. In both cases, the exercise and the stress will likely induce a temporary preponderance of the sympathetic branch.
Now that we know how to analyze it and we understand that different systems are likely to be associated with different frequencies, we can understand why historically HRV was seen as a good measure of imbalances in the ANS. Probably the best way to describe HRV would be as a surrogate measure of the complex interaction between the brain and the cardiovascular system.
So how does that relate to diving?
It has been demonstrated by many studies that a reduced HRV is related to decreased life expectancy. A reduction in HRV has been reported in several cardiological and non-cardiological diseases, ranging from diabetes to renal failure, to mention a few [2,3,4]. A reduction in HRV, when analyzed in the frequency domain has also been associated with inflammatory processes [4, 5].
It is interesting to note, however, that due to huge inter-individual variance, it is difficult to establish expected HRV parameters for a population, and although some interesting studies have been published over the years, there is no consensus on standard values for each one of the HRV parameters. On the other hand, intrasubject analysis, that is the variation of HRV for the same individual over time, can offer very important insights.

Scuba diving is known to trigger oxidative and inflammatory processes, causing a variety of alterations in our physiology, ranging from loss of endothelial function [6], that is the capacity of the vascular endothelium to respond to vasodilator stimulus, to the activation of the innate immune system and production of microparticles [7] i.e., particles shed by different cells, which carry nuclear components of their originating cells, like RNA and DNA, and are involved in cell signaling and communication.
As one could imagine, scuba diving is also related to alterations in HRV [8] and by studying the pattern of these alterations we could infer how our bodies are responding to a dive and, in particular, to the decompression. Our recent study demonstrated that HRV is negatively associated with the production of microparticles and that, using a model built with machine learning, it was possible to predict the pre to post dive variation of the HRV, based on the variation of specific inflammatory markers, linking inflammation and oxidative stress to HRV in scuba diving.
In the past decade, many studies have demonstrated that the presence of inflammatory processes are linked to lowering HRV (either in the time or frequency domains). In our study we demonstrated the inflammatory and oxidative process related to diving are also related to changes in HRV and, interestingly enough, to a preponderance of the sympathetic branch in cases where the volunteers presented more intense responses to the decompression. This fact is also probably linked to the loss of endothelial function, long observed to happen after diving, although the mechanisms are, at this point, not completely clear.
There is still a lot to be understood about the relationship of HRV alterations and diving. The hyperoxia, i.e., exposure to pressures of oxygen higher than 0.5 ATA associated with diving, has its own effects on HRV, making interpretation of HRV variations in diving even more complex. The long-term goal of our research is to better understand individual responses to decompression. We believe HRV variations can be a powerful tool to achieve this objective.
Our team has been working in cooperation with DAN Europe, which has a huge database of diving profiles and outcomes, and some interesting models are being created to model the oxidative and inflammatory processes, but there is still a long way to go before these models can be used in any practical application. However, it is a promising field, and its comprehension will surely help in the full understanding of decompression physiology, making this subject certainly something interesting for the diving community. We could even dream about being able to adjust our dive profiles based on individual responses, right? Watch this space.
References
- Ernst G. Heart-Rate Variability—More than Heart Beats? Front Public Heal. 2017;5(September):1-12. doi:10.3389/fpubh.2017.00240
- Malliani A, Pagani M, Lombardi F, Cerutti S. Cardiovascular neural regulation explored in the frequency domain. Circulation. 1991;84(2):482-492. doi:10.1161/01.CIR.84.2.482
- Appel ML, Berger RD, Saul JP, Smith JM, Cohen RJ. Beat to beat variability in cardiovascular variables: Noise or music? J Am Coll Cardiol. 1989;14(5):1139-1148. doi:10.1016/0735-1097(89)90408-7
- Sloan RP. Heart Rate Variability Predicts Levels of Inflammatory Markers: Evidence for the Vagal Anti-Inflammatory Pathway. 2015;(Bernik 2002):94-100. doi:10.1016/j.bbi.2014.12.017.Heart
- Adam Moser, Kevin Range and DMY. Relationship between Heart Rate Variability, Interleukin-6, and Soluble Tissue Factor in Healthy Subjects. Bone. 2008;23(1):1-7. doi:10.1038/jid.2014.371
- Brubakk AO, Duplancic D, Valic Z, et al. A single air dive reduces arterial endothelial function in man. J Physiol. 2005;566(3):901-906. doi:10.1113/jphysiol.2005.089862
- Thom SR, Bennett M, Banham ND, et al. Association of microparticles and neutrophil activation with decompression sickness. J Appl Physiol. 2015;119(5):427-434. doi:10.1152/japplphysiol.00380.2015
- Schirato SR, El-dash I, El-dash V, Natali JE, Starzynski PN, Chaui-berlinck JG. Heart rate variability changes as an indicator of decompression-related physiological stress. Undersea Hyperb Med. 2018;Mar-Apr 20:173-182.
- Schirato et al. Association between Heart Rate Variability and decompression-induced physiological stress. Front. Physiol. Front. Physiol., 03 July 2020
Dive Deeper:
- Schirato’s Talk at the 2019 GUE Conference: Heart Rate Variability: What it is and Why it Matters
- From GUE’s membership magazine QUEST: Decompression: Revisiting Old Assumptions by S.Rhein Schirato

Brazilian scientist, Sergio Rhein Schirato, is a hedge fund manager and a researcher at the Laboratory of Energetics and Theoretical Physiology of the Biosciences Institute of the University of Sao Paulo (USP). He holds a PhD in Sciences, a Masters in Finance jointly granted by New York University and London School of Economics and post graduation in applied Math. His current research includes the application of neural networks in decompression modeling and heart rate variability. Additionally, he is a GUE Fundamentals and Rec 1, 2 and 3 instructor, as well as GUE Rebreather certified diver.


Dial In Your DCS Risk with the Thalmann Algorithm

Deep Tunnel Workers Go Trimix

La Grande Dérive

California Dreamin’

British Invasion—Thailand Karst Edition 2024

Harnessing the Power of ‘Educated’ AI to Improve Diving Safety